Statistics vs Calculus: Which Course Should You Choose?
Statistics vs calculus is a choice between studying data and uncertainty and studying continuous change and accumulation. Choose your next course by its actual level, your prerequisites, and your program's requirements. Introductory statistics can be non-calculus-based; a probability theory course may require several calculus courses. Start by checking the course description and the classes it unlocks, then compare the work below.
What statistics and calculus ask
Statistics starts with data and a question: what does this sample tell us, how much variation is present, and what can we reasonably infer beyond it? OpenStax's statistics introduction distinguishes describing observed data from making inferences about a population. A numerical answer needs context: who was measured, how the observations were collected, and what uncertainty remains.
Calculus works with functions to study rates of change and accumulation. A derivative describes a rate at an instant; an integral can describe accumulation over an interval. The calculus overview explains how these ideas fit together. The two subjects overlap: statistics can use functions and calculus, and calculus can help analyze a model built from data.
The table compares non-calculus-based introductory statistics with first-semester calculus, not every course bearing either name.
| Comparison | Introductory statistics | First-semester calculus |
|---|---|---|
| Starting material | Observations, a study question, and a population or sample | A function, graph, or mathematical model |
| Typical question | What do the data show, and how far can the conclusion extend? | How fast is a quantity changing, or how much accumulates? |
| Main tools | Data summaries, probability, study design, and inference | Limits, derivatives, and integrals |
| Explanation required | Interpret results and justify statistical conclusions | Interpret rates or accumulated quantities and justify mathematical reasoning |
| Preparation to check | The course's algebra requirements | Algebra, functions, and the course's trigonometry requirements |
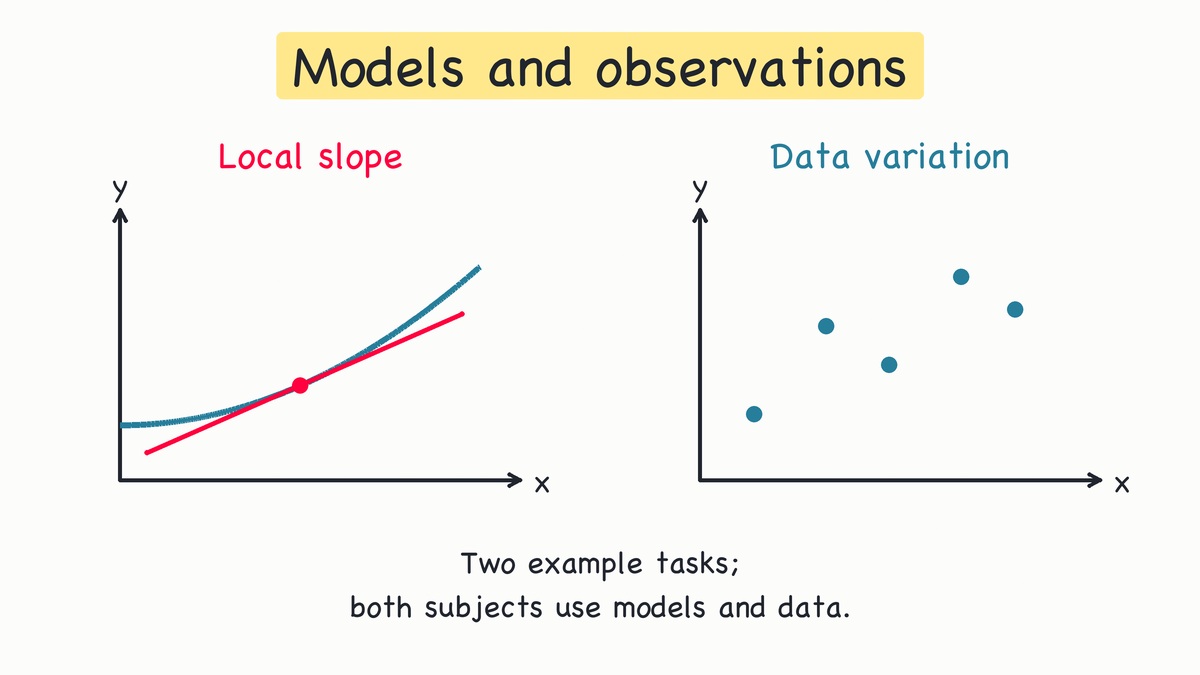
The sketch compares a known function's local slope with variation among observations. These are two example tasks; both subjects can use models and data.
Is statistics harder than calculus?
The subject name does not settle the difficulty. Check the course number, description, prerequisites, and sample assignments. Comparing AP Statistics with a calculus-based probability course gives a misleading answer because their starting points differ.
Introductory statistics and AP Statistics
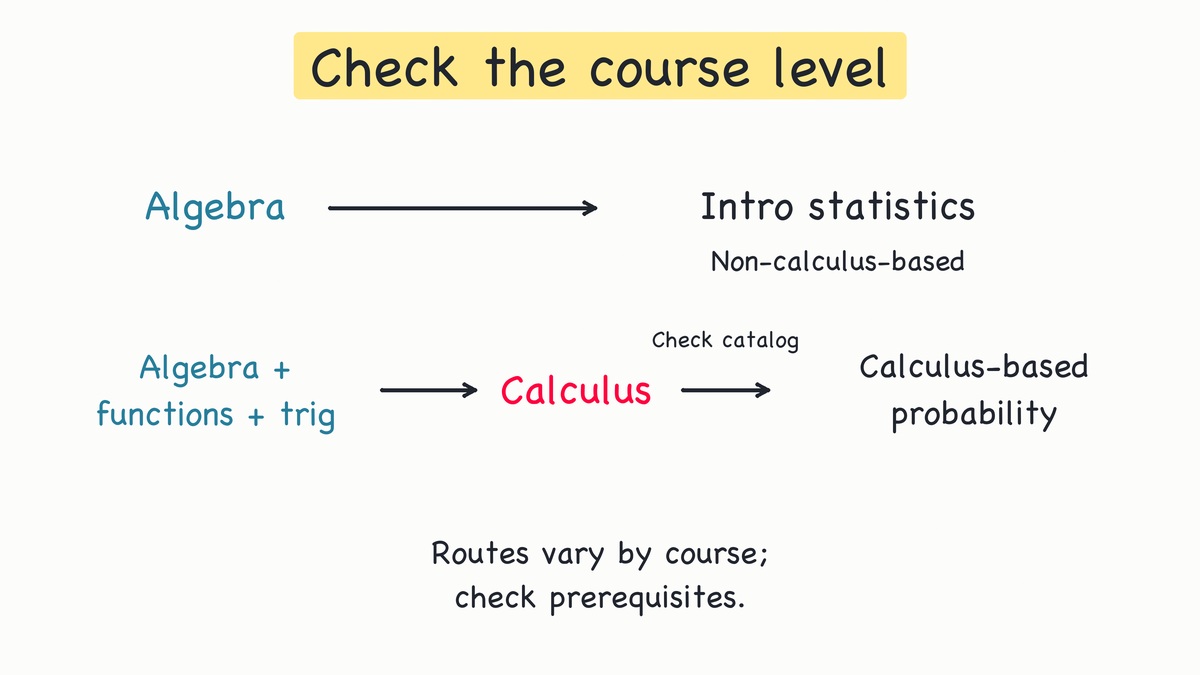
The current AP Statistics course page, checked November 10, 2026, describes a non-calculus-based introductory college equivalent and recommends a first-year algebra course. Your school's enrollment rules may add requirements, so confirm them locally.
Expect work with data collection, probability, inference, and statistical reasoning. Being comfortable with percentages or a calculator helps with computations, but an answer also has to explain its meaning. For example, a sample average describes the observations you collected; whether it represents a larger population is a separate question.
If algebra is manageable but interpreting a word problem feels difficult, preview a statistics assignment before choosing it. Identify the population, sample, variable, and conclusion the problem asks for. That exercise reveals a different kind of preparation gap from difficulty manipulating a function.
Calculus 1 and calculus-based statistics
The AP Calculus AB course page describes first-semester differential and integral calculus. Its recommended preparation includes algebra, geometry, trigonometry, analytic geometry, and elementary functions. Students should be able to graph functions and solve equations involving them. It also explicitly includes justifying reasoning and solutions.
In calculus, you need to work with functions and explain your reasoning. If simplifying expressions or reading graphs repeatedly stops you, review those skills before adding limits and derivatives. Strong arithmetic alone does not remove those prerequisites.
Advanced statistics can require this preparation too. Penn State's STAT 414, a probability theory course, lists a standard three-course calculus sequence and knowledge of matrix or linear algebra. This is a specific course example, not a rule for every statistics class. It shows why “statistics first or calculus first?” must be answered at the course level.
The two routes below show that distinction. Follow your own catalog when a course has additional or different requirements.
Two problems, two kinds of reasoning
These invented examples use a motion setting to make the difference concrete. The calculus problem supplies a position model. The statistics problem supplies repeated measurements. Neither is a record of a real student or experiment.
Calculus: a rate at one instant
Suppose a moving object's position is modeled by s(t) = t² + 2t, with position in meters and time in seconds. The coefficients have the units needed to make the position a distance. Find its instantaneous velocity at t = 3.
- Differentiate the position function. The differentiation rules give
s′(t) = 2t + 2. - Substitute the requested time:
s′(3) = 2(3) + 2 = 8. - Interpret the units: the modeled velocity at that instant is 8 m/s.
Check the distinction between an instant and an interval. Between t = 1 and t = 3, the positions are s(1) = 3 and s(3) = 15. The average velocity is (15 − 3)/(3 − 1) = 6 m/s. That value describes the whole interval, so it need not equal the endpoint velocity.
For a closer check at t = 3, use a short interval of length h. The difference quotient is [s(3 + h) − s(3)]/h = 8 + h for nonzero h. As h approaches zero, the quotient approaches 8. This verifies the derivative's local-rate meaning. The result remains conditional on the supplied position model.
Statistics: what repeated measurements show
Now suppose four repeated trials record one-second displacements of 7, 8, 8, and 9 m. Find the mean displacement and explain what it describes.
Add the four measurements and divide by their count:
mean displacement = (7 + 8 + 8 + 9)/4 = 32/4 = 8 m
The mean displacement across these four trials is 8 m. The measurements vary from 7 to 9 m, so the mean does not tell the whole story. Keep the individual observations alongside the summary when comparing trials.
Because each trial lasts one second, the corresponding interval-average velocities have numerical values of 7, 8, 8, and 9 m/s. Their mean is 8 m/s. These are averages over measurement intervals; the observations do not establish an instantaneous velocity at a particular time.
Before extending the result to other trials, ask whether the measurement conditions stayed consistent and whether the trials represent the process you want to describe. Calculating a sample mean is one step. The statistical task also requires explaining what that mean describes.
Both examples produce the number 8, but the answers describe different things: a modeled rate at an instant and a summary of repeated observations.
Where the subjects meet
Calculus can calculate probabilities for continuous distributions. The statistical work also includes deciding whether the model is appropriate.
Assume, purely for this example, that a waiting time is uniformly distributed between 0 and 10 minutes. The uniform distribution has constant density f(x) = 1/10 on that interval and zero density outside it. “Uniform” means intervals of equal length within the range have equal probability.
The probability of waiting between 2 and 5 minutes is the area under the density over that interval:
P(2 ≤ X ≤ 5) = (5 − 2)(1/10) = 3/10 = 0.3
Calculus expresses the same calculation as ∫₂⁵ (1/10) dx = 3/10. The total area is 10(1/10) = 1, which checks that the model assigns total probability one.
In this continuous model, density height is not the probability of one exact waiting time. OpenStax's continuous probability explanation defines interval probability as density area. A single point has zero width, so its area and probability are zero. An interval, however short, has width. Recorded times rounded to whole minutes are a different measurement setup and should not be treated as exact continuous points.
The figure uses a separate 0–8 minute example. The highlighted 2–6 minute interval covers half the total area.
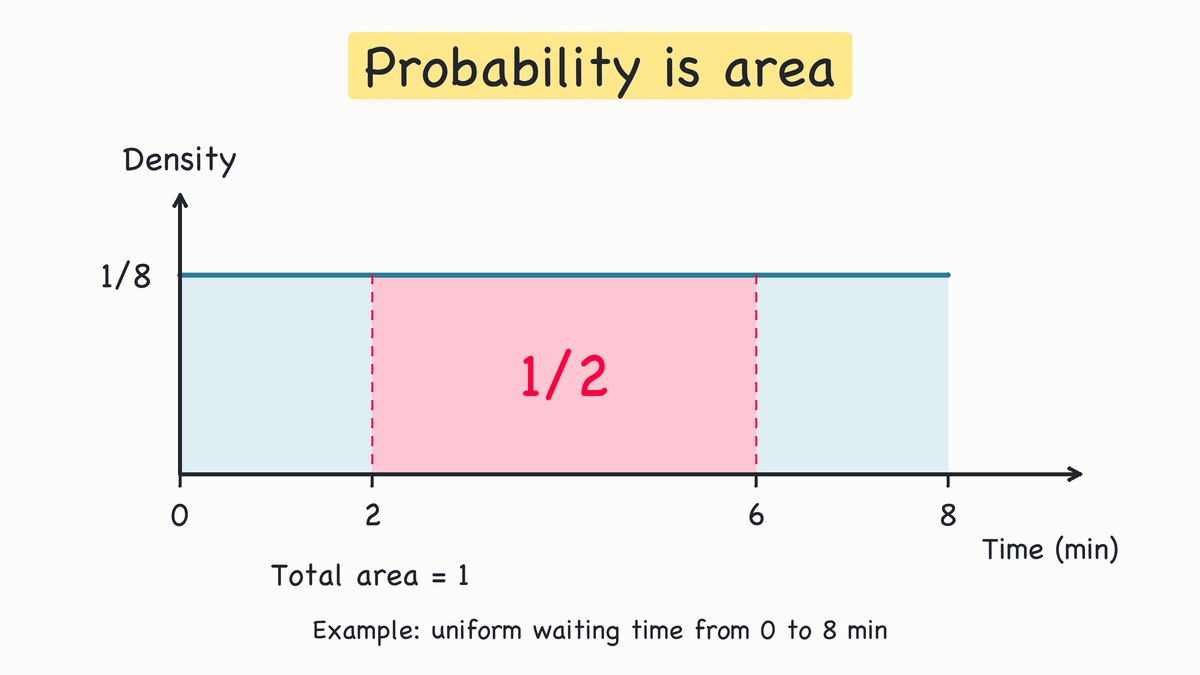
You can find a uniform probability with rectangle geometry without learning integration first. More complex continuous densities can require calculus. Neither calculation establishes that a real waiting-time process is uniform; that assumption still needs evidence.
Which course should you choose?
Choose statistics or calculus first by checking requirements before preferences. A course that seems more appealing may not satisfy the prerequisite for the class you need next.
- A later required course needs calculus: plan the calculus sequence in time to meet that prerequisite. Check your algebra, functions, and trigonometry preparation. Use the precalculus guide to identify material to review, then confirm readiness with your teacher or advisor.
- You can choose an elective and want to interpret data: a non-calculus-based introductory statistics course can be a suitable starting point if you meet its requirements. Preview its work on study design and conclusions, not just its computation exercises.
- You want calculus-based probability or statistics: read that specific course's prerequisites. Penn State's example requires several calculus courses and matrix algebra; another institution may organize its sequence differently.
- Your program uses both subjects: plan both within your schedule. Ask which is required sooner, which satisfies a degree requirement, and whether one unlocks a later course. Do not assume an introductory statistics credit replaces a calculus requirement, or the reverse.
Use your planned major's curriculum to make the choice. Write down the next required course and its course number, then work backward through its prerequisites; a general career list cannot establish those requirements.
Research on course choice does not guarantee a college or career outcome. The Fordham study compared AP Calculus AB and AP Statistics students using Texas administrative data and adjustments for observable differences. Its limitations acknowledge that unobserved factors, such as students' existing aspirations, may still explain outcome differences. That evidence cannot determine what switching courses would do for you individually. Your required curriculum and preparation are more actionable checks.
Preview the course before enrolling
Ask for an early assignment or a sample problem from each course. Use it to locate the skills you already have and the ones that need review.
For introductory statistics, practice reading a small data display, calculating a mean, and explaining whom the data describe. See descriptive statistics for how to calculate and report those summaries. Then try a study-design question: identify whether its conclusion reaches beyond the people measured and what information would justify that step.
For calculus, try evaluating and graphing a function, simplifying an algebraic expression, and explaining a graph's slope. Check the trigonometry requirements in the course description. The Calculus 1 guide previews the limits, derivatives, and integrals that come next.
If you want focused practice on a gap you found, open Gauth's Create Course and enter a topic with your current level, such as introductory data interpretation or functions before calculus. Use that learning practice alongside your school's course advice.
Bring the course numbers, prerequisite list, sample work, and your degree requirements to your teacher or advisor. Ask one specific question: “Which course should I take now to stay ready for my next required class?”
Sources and review
Sources accessed November 10, 2026. The worked examples and figure values are illustrative, not measured research data.
- College Board — AP Statistics: current course equivalency, recommended prerequisites, and statistical reasoning.
- College Board — AP Calculus AB: current course equivalency, function preparation, and reasoning requirements.
- Penn State — STAT 414: probability course overview and its Prerequisites tab.
- OpenStax — Uniform distribution: constant density and interval area.
