What Is Statistics? Meaning, Examples, and What You Study
Statistics is the study and practice of learning from data: deciding what to collect, summarizing observations, analyzing patterns, and explaining what the results support. Descriptive statistics describe the data you have; inferential statistics use sample evidence to draw conclusions about a population under stated conditions. Begin with three questions: What was measured, how were the observations obtained, and how far can the conclusion reasonably reach?
Statistics is a way of learning from data
The word has two related uses. In a news report or a sports broadcast, “statistics” can mean numerical summaries. As a subject, statistics concerns the methods used to collect, analyze, interpret, and communicate data. The Australian Bureau of Statistics explicitly distinguishes the practice from a value produced through data collection.
A statistical question usually concerns a group or a process in which observations can vary. “How long was this particular trip?” asks for one measurement. “How do morning commute times vary among students at this college?” calls for multiple observations and a way to describe that variation. The answer may describe a typical time and the distribution of times, while specifying whom the records cover.
Statistical work begins before the calculation. The University of Melbourne includes designing data collection, summarizing information, drawing conclusions, and estimating or predicting within its description of the discipline. Even a correct average can answer the wrong question when the observations were selected poorly or measured inconsistently.
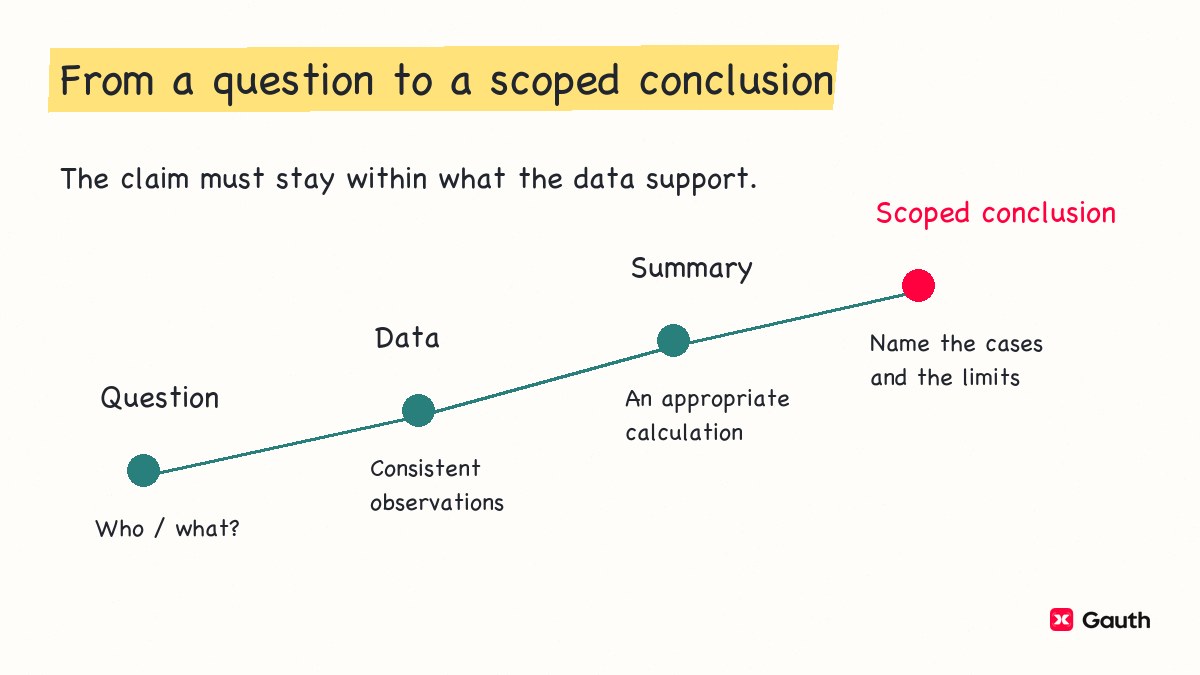
The four-stage sketch places the calculation between data collection and reporting. At the final stage, explain what the evidence supports without treating an observed pattern as a universal rule.
Data, statistics and parameters are different things
Data are the recorded observations. A row might describe a person, a trip, a plant, or an item produced by a machine. A variable is a characteristic recorded for those cases, such as travel mode or duration. Define what one row represents so that repeated records are not mistaken for different people.
A population is the full group of cases your question concerns. A sample is the subset from which you collect data. A statistic, in the usual sample-based sense, is a measure calculated from the sample. A parameter describes the population. These distinctions appear in Penn State's data-collection lesson.
For example, the mean commute time of a surveyed group is a sample statistic. The mean for all students in the specified college and term is a population parameter. The measurement is the same; the sets of cases differ. If you had complete, accurate records for that entire defined population, its mean would not need to be estimated from a sample.
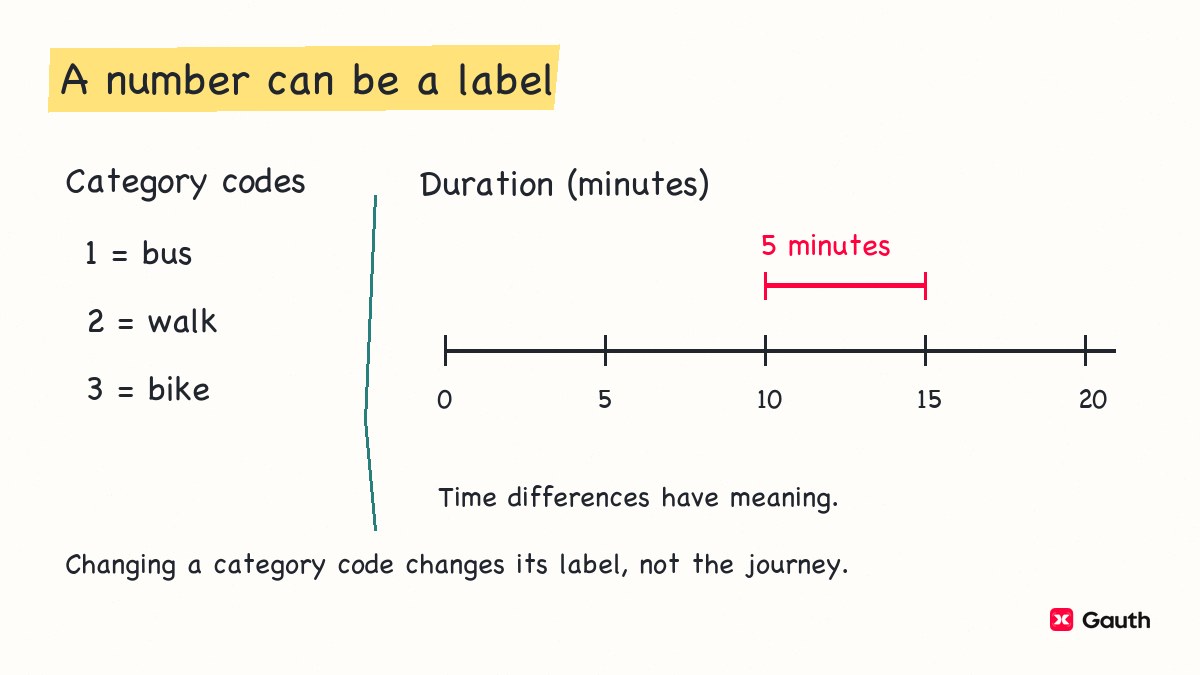
Not all data are quantities. Travel mode is categorical: bus, walk, and bike name groups. Duration in minutes is quantitative because the numerical differences represent differences in time. Coding bus as , walk as , and bike as does not make those labels into meaningful travel amounts. An average of the codes would change if you changed the coding scheme.
The diagram separates category codes from measured quantities. Check whether addition and numerical differences have a sensible interpretation before calculating a mean. Counts and percentages can still summarize categories without pretending that a category code is a measurement.
The two main branches of statistics
Descriptive statistics organize and summarize observed data. Counts, percentages, measures of center and spread, tables, and graphs can describe a sample or an entire recorded population. Interpreting a graph is descriptive work too: it may show substantial variation hidden by an average.
Inferential statistics use sample data to draw conclusions about a population, often through estimation or hypothesis testing. Their uncertainty depends on the design and the statistical method's conditions. The ABS includes both estimation and testing in its explanation of inference.
| Task | What the answer concerns | What you must not assume |
|---|---|---|
| Describe the mean of eight recorded trips | Those eight observations | That they represent every student or every future trip |
| Estimate the college's mean commute time | A defined population beyond the recorded trips | That a convenient set of trips justifies that wider claim |
| Compare two observed travel groups | The recorded group summaries | That travel mode caused the difference |
The claim determines the distinction; the tool alone does not. A fitted line can describe the observations; using it to estimate a broader relationship or predict beyond those observations raises additional questions. Calculating a p-value does not repair an unclear target population or an unsuitable sampling process.
For detailed summary calculations, continue with descriptive statistics. This page introduces the discipline and its reasoning; it does not provide a complete variance calculation, confidence-interval procedure, or test-selection chart.
A small example: what can a commute table tell you?
The following records are invented for teaching. They are not a survey of real students and were not collected through a verified sampling design. Treat each row as one morning trip by a different student. Use the example to connect the question and variable with the denominator and reporting scope.
Define the question and the observations
Our descriptive question is: What do these eight recorded morning trips show about duration, travel mode, and arriving late? It does not ask whether one mode causes lateness or whether these records represent all college students.
| Trip | Mode | Duration (minutes) | Arrived late? |
|---|---|---|---|
| 1 | Bus | 8 | No |
| 2 | Walk | 10 | No |
| 3 | Bus | 10 | No |
| 4 | Bike | 12 | No |
| 5 | Walk | 14 | No |
| 6 | Bus | 16 | Yes |
| 7 | Walk | 18 | Yes |
| 8 | Bus | 24 | Yes |
A real study would also define “arrived late,” the observation period, and how duration was measured. Was a trip timed door-to-door, from boarding a bus, or from entering the campus? Different definitions can produce different values even for the same journey.
For a population question, specify the college, term, and eligible students before choosing a sample. If you record repeated trips from the same student instead, say so: you then have trip-level observations, and those observations may be related. The number of rows alone does not establish the number of independent students.
Summarize the right variable
Use a mean for the measured duration, not for the travel-mode labels. Add the eight durations and divide by the number of observed trips:
The sorted durations are . The median is the average of the two middle values:
The mode is minutes because that value occurs most frequently. These summaries answer different questions. The mean uses every duration; the median locates the middle of the ordered observations; the mode identifies the most frequent recorded value. Each describes a different aspect of the observations, so do not treat them as interchangeable definitions of “average.”
For travel mode, count the categories: bus appears in four rows, walk in three, and bike in one. Those counts add to eight. Bus is the most frequent mode in this table, but the durations are a separate variable. A category count does not tell you the average travel time within that category.
Three trips are marked late, and all eight rows have a known late/not-late result. The observed late proportion is:
The denominator is the eight trips with recorded outcomes. If some invited students did not respond, their outcomes would be missing, not automatically “No.” State whether a percentage uses all invitations, all respondents, or only the respondents with usable answers. They are different denominators.
Write a conclusion the data can support
A suitable descriptive report is:
In these eight illustrative morning trips, the mean duration was 14 minutes, the median was 13 minutes, and the most frequent duration was 10 minutes. Bus was the most common recorded travel mode, appearing in four trips. Three of the eight trips were marked late, an observed proportion of 37.5%. These records describe this teaching table; they do not establish a college-wide lateness rate or a causal effect of travel mode.
The report specifies which observations it describes. It keeps the variables separate, preserves the units, and ties the percentage to its denominator and scope. “College students are late of the time” would be a much stronger statement and is not supported by this constructed table.
Use the limits in the report to plan the next question. If the purpose is to understand college-wide commuting, plan an appropriate collection process. If the purpose is to compare travel modes, define the comparison and consider other differences, such as distance or class start time. Collecting more rows without resolving those issues may leave the original problem in place.
How probability fits into statistics
Probability provides mathematical models of chance. Given a model, you can calculate the chances of possible outcomes. Statistical work uses observations to describe what happened and, when the method allows, to learn about an unknown quantity with uncertainty. Melbourne describes probability as a companion subject that supports statistical prediction.
Consider a coin. A model that stipulates an independent fair toss assigns a probability of to heads on each toss. Recording actual tosses produces data. The observed fraction of heads describes those recorded outcomes; using the data to assess an unknown heads probability is an inferential task. The two directions are helpful for orientation, but they are not a complete definition of every probability or statistical method.
Do not confuse an observed frequency with a model guarantee. A short sequence need not contain exactly half heads even under the fair-coin model. Nor does a roughly balanced sequence prove that the coin is fair. The assumptions, amount of data, and question determine what analysis is appropriate.
What you study in a statistics class
An introductory statistics class usually combines data interpretation with calculations and technology. The exact balance depends on the course. Check its description and syllabus before assuming that the title “Statistics” means a particular level of mathematics or a fixed list of tests.
Penn State's public STAT 200 notes provide one concrete example. The curriculum covers data collection, descriptive summaries, confidence intervals, hypothesis testing, normal distributions, one- and two-sample inference, one-way ANOVA, chi-square tests, and correlation and simple linear regression. This is an example of a university introductory course, not a universal syllabus.
Its prerequisite review includes arithmetic, fractions, radicals, exponents, summations, and basic linear equations. It emphasizes statistical literacy and using technology. That does not mean that all statistics courses are calculus-free: a course in mathematical statistics or probability theory may have different prerequisites. Use your institution's actual requirements.
You will interpret variables, choose methods, read graphs or software output, and explain results in context. When practicing a formula, work through the calculation, interpret its result, and check whether it answers the question.
If your next decision is whether to take statistics or calculus, compare the specific courses, prerequisites, and program requirements. That course-choice task is separate from understanding what statistics means.
Read a statistical claim with five checks
Use the following checks to inspect the evidence behind a number in an assignment, chart, survey summary, or report:
- Who and what? Identify the cases, variable, units, population, and period. A count of trips is not necessarily a count of people.
- How collected? Check selection, measurement, and non-response. A larger convenience sample does not automatically correct the selection process.
- Which denominator? Identify the group used in a fraction or percentage, including exclusions and missing outcomes.
- What variation or uncertainty? A single average does not show the whole distribution. A population estimate needs more than a sample summary.
- How far does the claim reach? Distinguish an observed association from a causal explanation, and the recorded sample from a broader population.
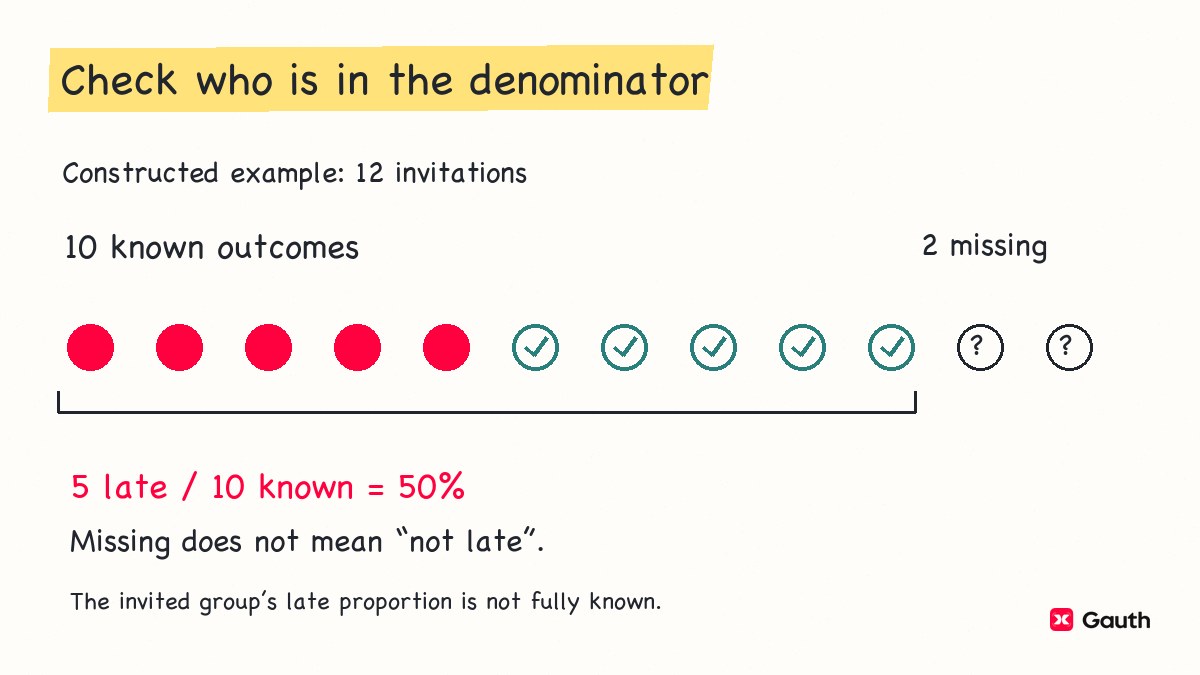
The illustration below uses a different example. Five of ten known outcomes are late; two outcomes remain missing among twelve invitations. The proportion among the known outcomes is . Dividing five by twelve would answer a different question, and it would not identify the late proportion among all invited cases while two outcomes are unknown.
Penn State's collection lesson explains sampling bias, non-response, and the difference between observational and experimental designs. Use those distinctions to inspect the collection process. A small p-value, a tidy chart, or a large number of observations does not by itself establish a causal explanation.
Missing information calls for a narrower conclusion, not a guess. “Half of the ten respondents with recorded outcomes were late” is more defensible than “Half of everyone invited was late.” Ask for the missing denominator, collection details, or uncertainty measure before accepting the broader claim.
Choose one skill to practice next
If the terms are still unclear, take a small table and identify its cases, variables, population, sample, statistic, and parameter. Explain why a category label is not a measured amount. If those distinctions are clear, practice a descriptive summary and write a sentence naming the observations, units, denominator, and limits.
If your difficulty is generalizing beyond a sample, move to sampling design and inferential statistics rather than calculating more averages. If it is course preparation, compare your syllabus with the skills you can already explain. Choose the specific gap you need to address before memorizing more tests.
For focused study, open Gauth's Create Course and enter your level and one topic, such as identifying variables, understanding sample statistics, or interpreting survey percentages. Check any resulting material against your assigned course and its definitions. This is a learning aid, not a substitute for checking the data or explaining your own reasoning.
Sources and review
Pages were consulted November 10–11, 2026. The commute table and teaching diagrams use constructed examples, not records of real students. The authority data were queried from the available November 10 snapshot.
- Australian Bureau of Statistics: statistics as a discipline and as numerical information; descriptive and inferential work.
- University of Melbourne: data-collection design, summarizing, drawing conclusions, and the role of probability.
- Penn State — Collecting data: cases, variables, populations, samples, statistics, parameters, sampling bias, non-response, and study design.
- Penn State — STAT 200: the concrete curriculum example used in the class section.


